Model to maximize H1-B visa chances
Problem Statement:
Lets consider a Law Firm called 'Immigrant Success' and its the period before 2019 when the lottery system did not exist. The firm wants to provide few key insights to their clients on maximizing the chances of H1-B being approved.
To solve this, they want me (a Data Scientist) to use the historical data of H1-B cases and identify key factors.
The Datasets used in this project is from kaggle:
https://www.kaggle.com/datasets/thedevastator/h-1b-non-immigrant-labour-visa
The following are the columns and what they mean:
case_year: The year in which the case was submitted. (Integer)
case_status: The status of the case, either approved or denied. (String)
case_submitted: The date on which the case was submitted. (Date)
decision_date: The date on which the decision was made. (Date)
emp_name: The name of the employer. (String)
emp_city: The city in which the employer is located. (String)
emp_state: The state in which the employer is located. (String)
emp_zip: The zip code of the employer. (Integer)
emp_country: The country in which the employer is located. (String)
job_title: The title of the job for which the visa is being applied. (String)
soc_code: The Standard Occupational Classification code for the job. (Integer)
soc_name: The name of the Standard Occupational Classification for the job. (String)
full_time_position: Whether the position is full-time or not. (Boolean)
prevailing_wage: The prevailing wage for the job. (Integer)
pw_unit: The unit of the prevailing wage. (String)
pw_level: The level of the prevailing wage. (String)
wage_from: The minimum wage for the job. (Integer)
wage_to: The maximum wage for the job. (Integer)
wage_unit: The unit of the wage. (String)
work_city: The city in which the job is located. (String)
work_state: The state in which the job is located. (String)
emp_h1b_dependent: Whether the employer is H-1B dependent or not. (Boolean)
emp_willful_violator: Whether the employer is a willful violator or not. (Boolean)
lat: The latitude of the job location.(Float)
lng: The longitude of the job location. (Float)
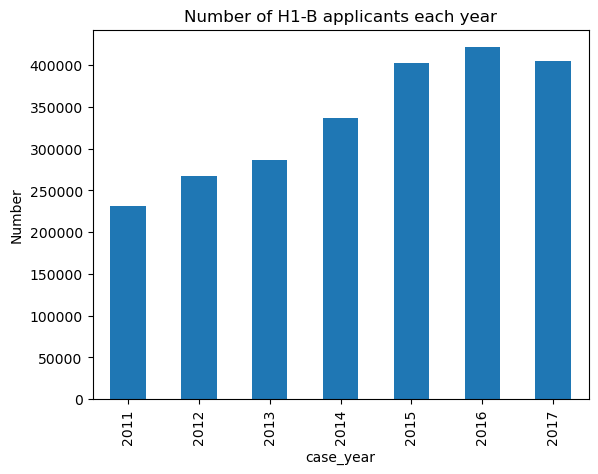
First, I divided the data into training (70%) and testing data (30%) and explored the training data to gain some insights. The reason I analyzed only the training data is to avoid data leakage. Here are few insights:
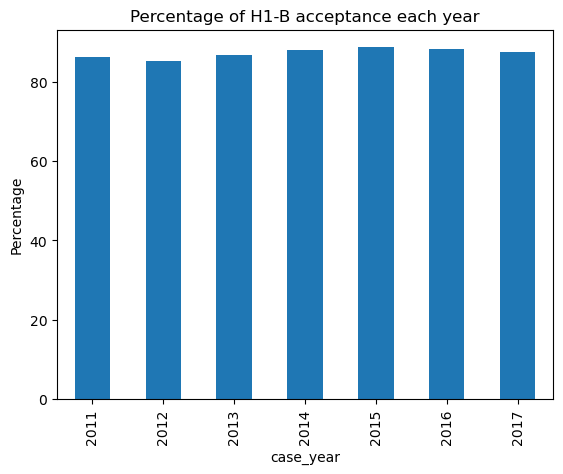
1. Eventhough the number of applicants increase each year, the percentage of acceptance remains constant.
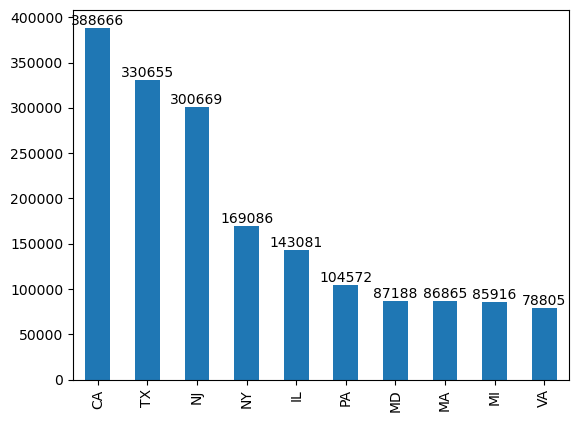
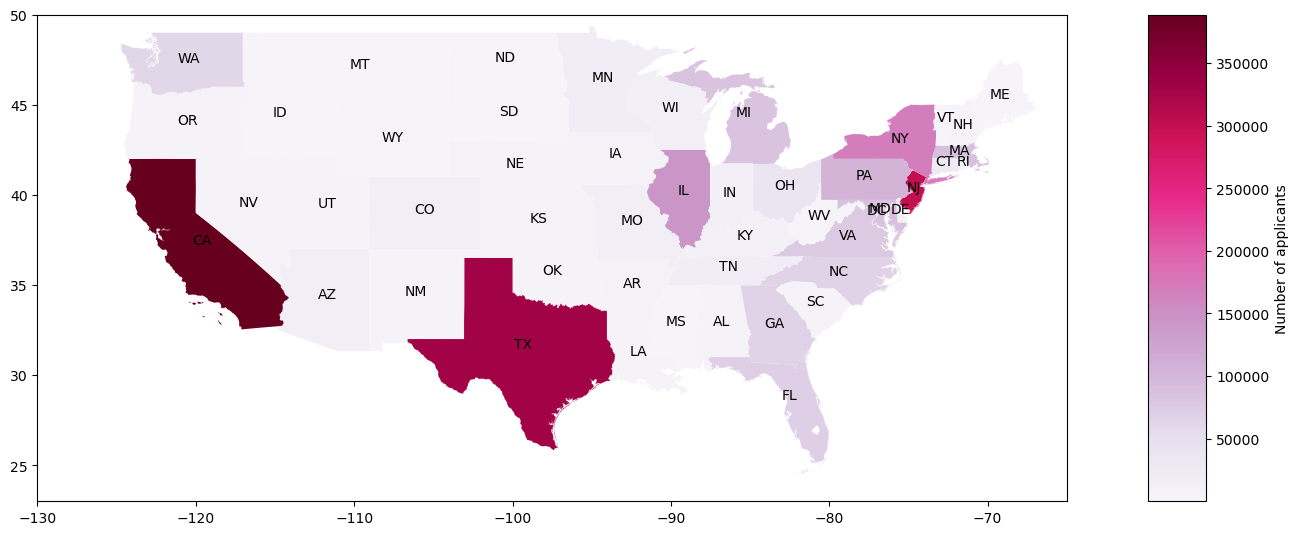
2. California is the highest STATE where employers are applying for H1-B (2011 to 2017 cumulatively) with 3,88,666 total applicants. [Top 10 states shown below]
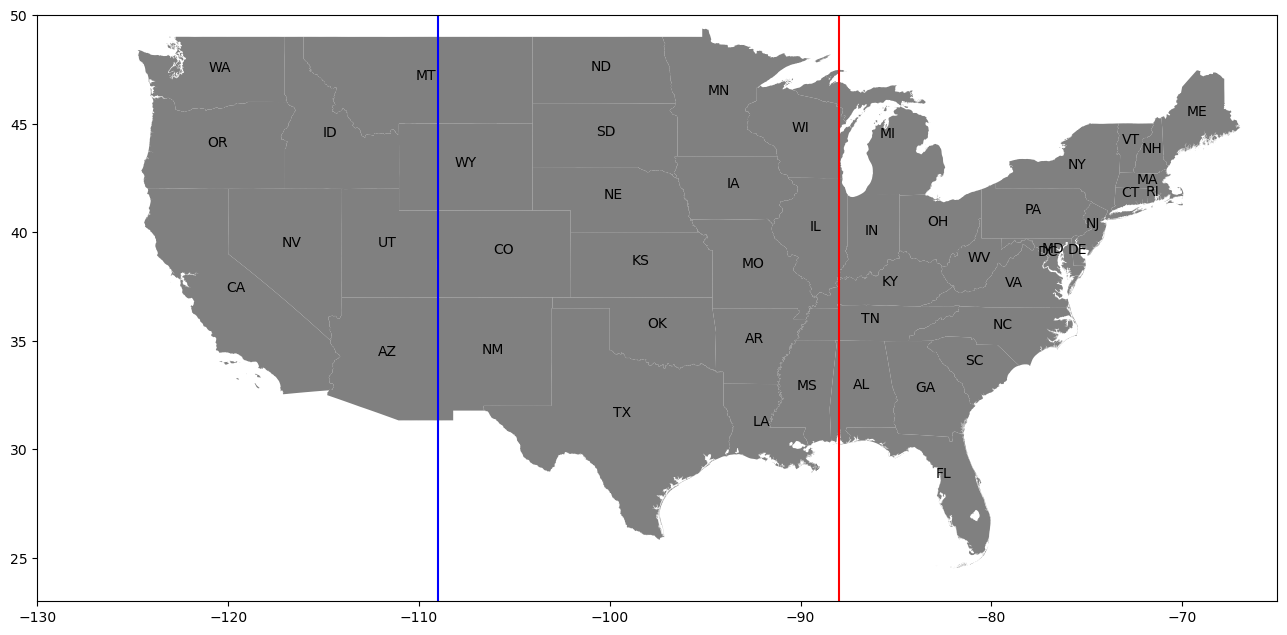
Below is the visualization on USA map using geopandas to get an overview:
3. Plano, TX is the highest CITY where employers are applying for H1-B (2011 to 2017 cumulatively) with 1,35,573 total applicants. [Top 10 cities shown below]
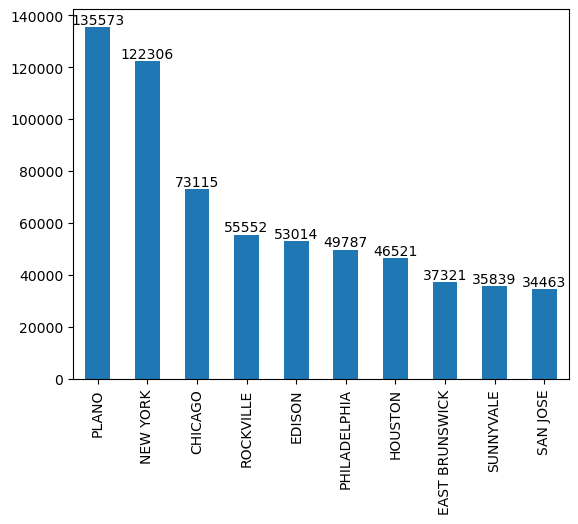
Note that here, the top empolyer city does not belong to the top employer state
Plano, TX has the most number of employees applying compared to other cities.
But overall, California has the highest number of employess applying.
The reason for this because there are significantly higher number of employee cities in California compared to Texas even though one of its cities (Plano) has significantly higher employers.
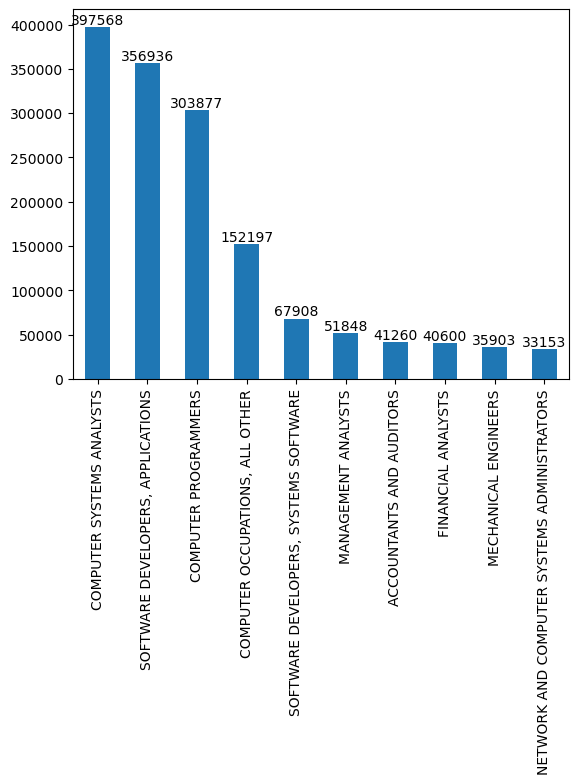
Note: The 2018 Standard Occupational Classification (SOC) system is a federal statistical standard used by federal agencies to classify workers into occupational categories for the purpose of collecting, calculating, or disseminating data. All workers are classified into one of 867 detailed occupations according to their occupational definition.
5. Top 10 Job titles of applicants (2011 to 2017 cumulatively).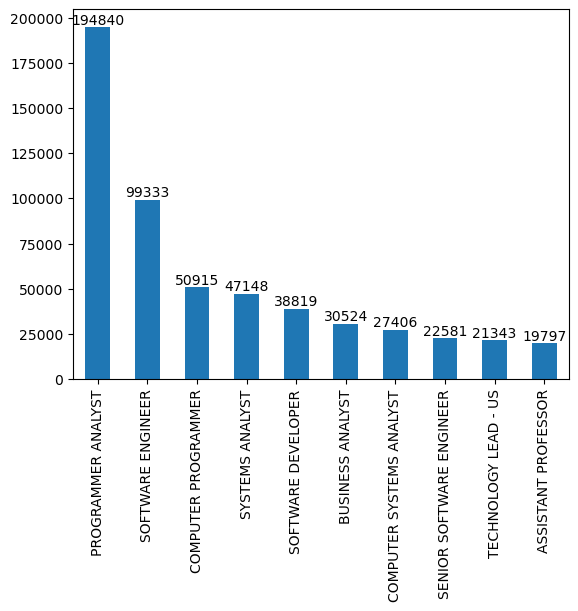
We can see that most of the top job titles belong the computer science sector.
6. Number of applicants belonging to different levels of the H1-B prevailing wage (2011 to 2017 cumulatively).
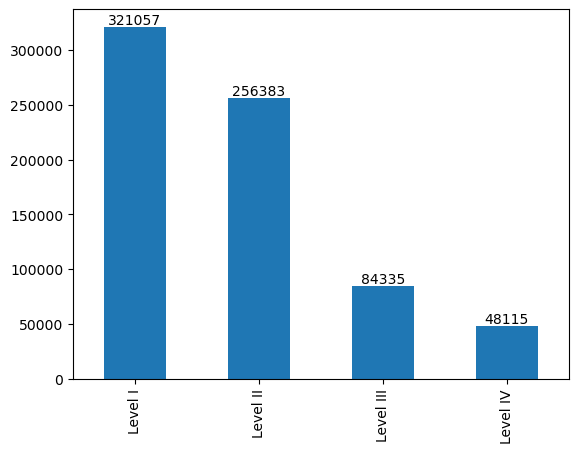
Most of the applicants belong to Level 1 wage level, which is the minimum wage limit for employees with least experience.
To get a better picture of the data and to allow users to interact and analyse, I created a Tableau dashboard: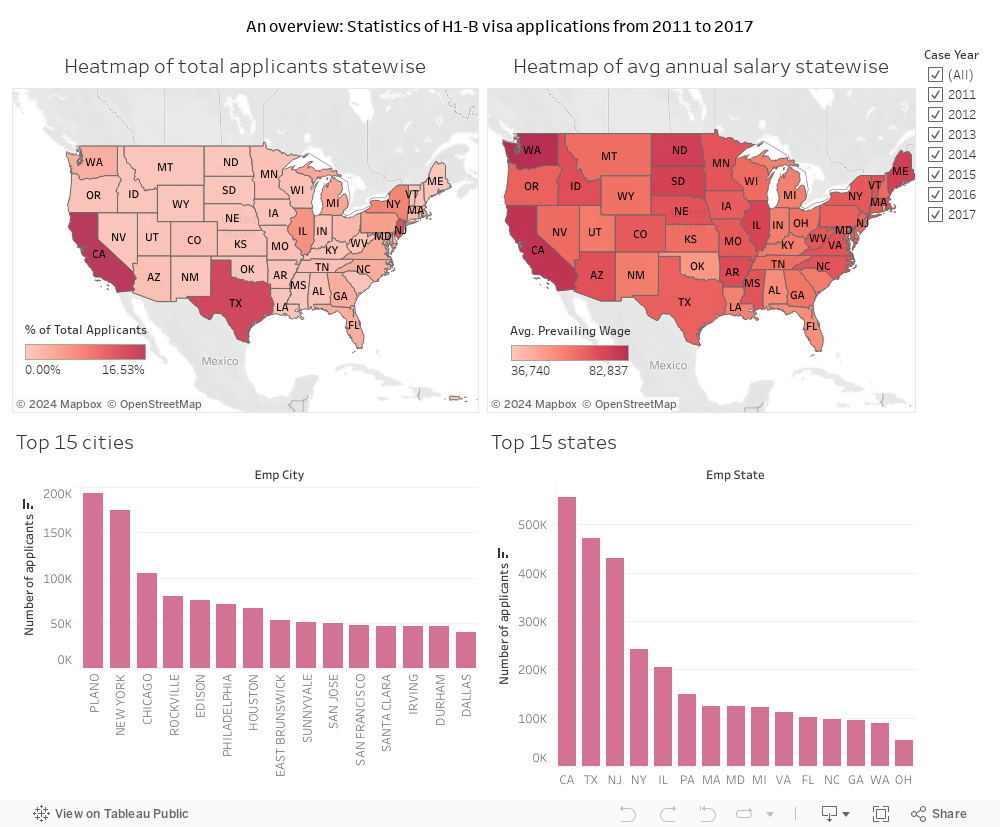
View on Tableau Public
After the analysis, I decided to do some feature engineering and build a classification model to predict the results of H1-B cases based on the input features. I am also extracting important key features from this model.
Feature Engineering:
1. Dividing the states for 'emp_state' and 'work_state' into 3 categories: west, mid, east based on their position in the USA, as the name suggests:
2. Now, for the 'soc_name' column: The name of the Standard Occupational Classification for the job, This columns has nearly 1314 unique values and I want to cluster them to 7 categories using regular expressions:
computer - Computer related jobs
engineering - other engineering fields jobs other than computer
medicine - Medicine related jobs
law - law related jobs
teaching - teaching related jobs
research - advanced research related jobs
nonstem - all other jobs apart from the above categories
Additionally, I standardized the numerical variables using standard scaler and for the 'wage' column: The wage was given in different rates: hourly, weekly, bi-weekly, monthly, yearly. So, I converted them uniformly into hourly rate.
Modeling:
Initially, I ran random forest classifier model with data from all the years and got a very bad model performance. This is a classic case of garbage-in and garbage-out example in Machine Learning. The reason for the bad performance is mostly due to the non-consistent data. By intuition we can also say that policies for H1-B keep changing each year and hence I decided to train the model only on the latest year - 2017. This will also give us insights on H1-B based on the latest policies.
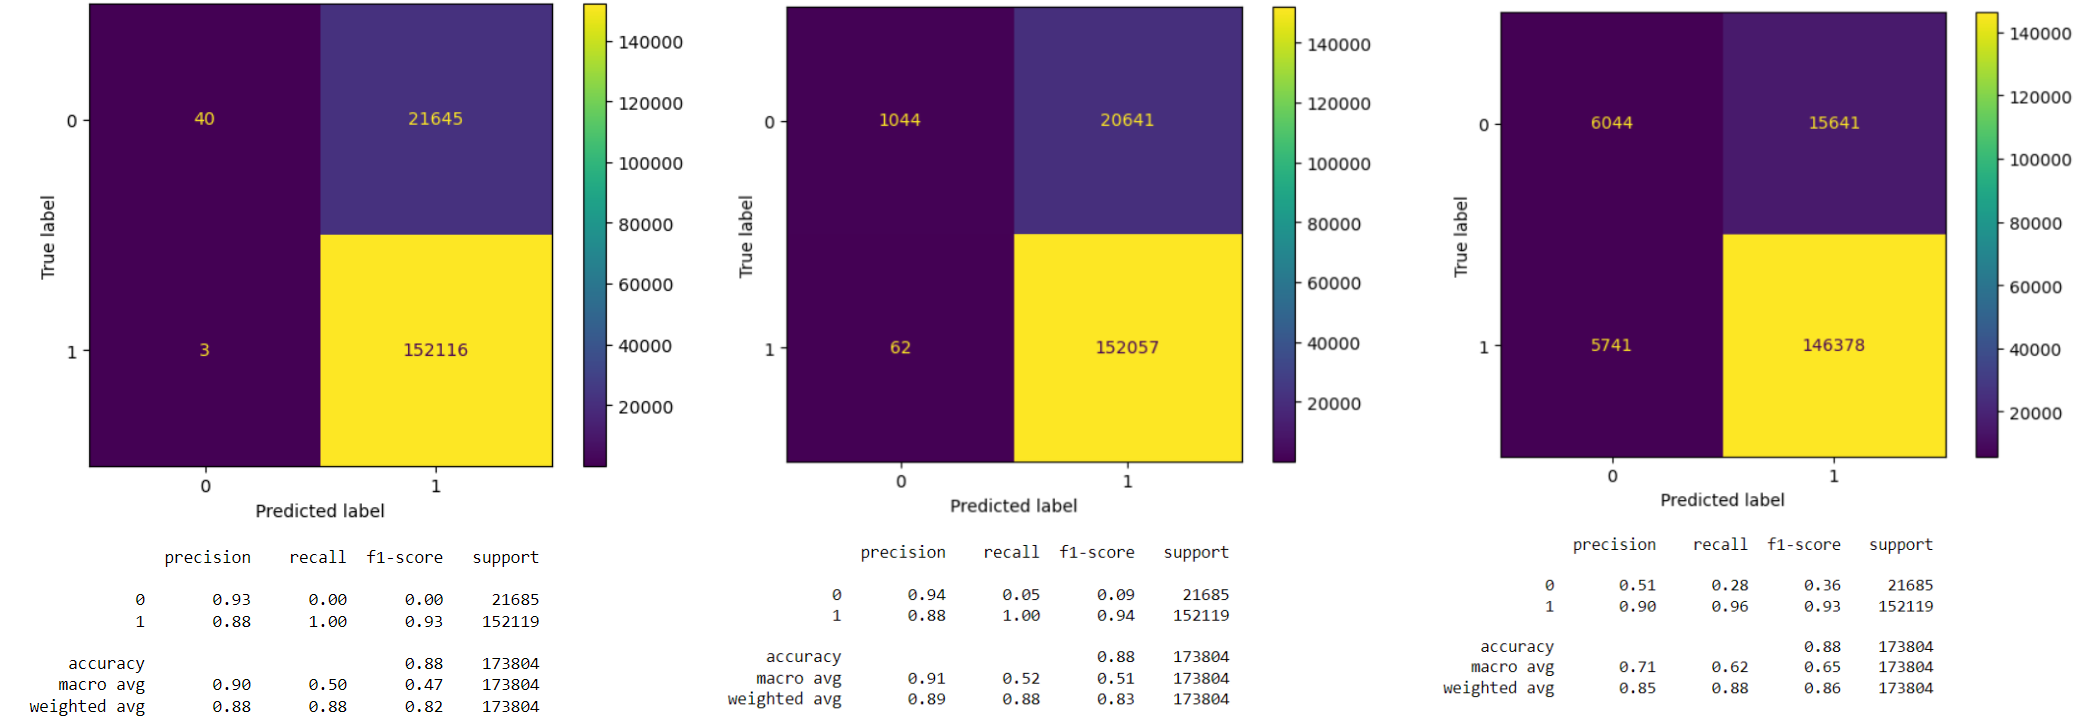
I decided to use logistic regression as the baseline model and tree based models like random forest, LightGBM models as comparing models to see if the performance improves. The confusion matrix and model performance for different models are given below:
TOP FEATURES:
As our final model is the random forest classifier, we can use the Gini importance score calculated in decision trees to compute the feature importance.
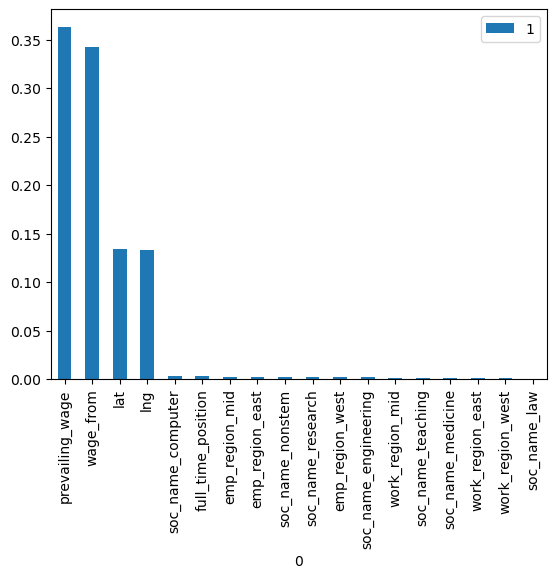
Wages of the applicant seems to be the most important factor followed by location (latitude, longitude) of the job position. The low importance of other categorical features like soc_name and region can be because of the coarse feature engineering. Increasing the number of clustered categories for each variable might improve the model.
Feel free to checkout the code in the github repository:
Github Repository